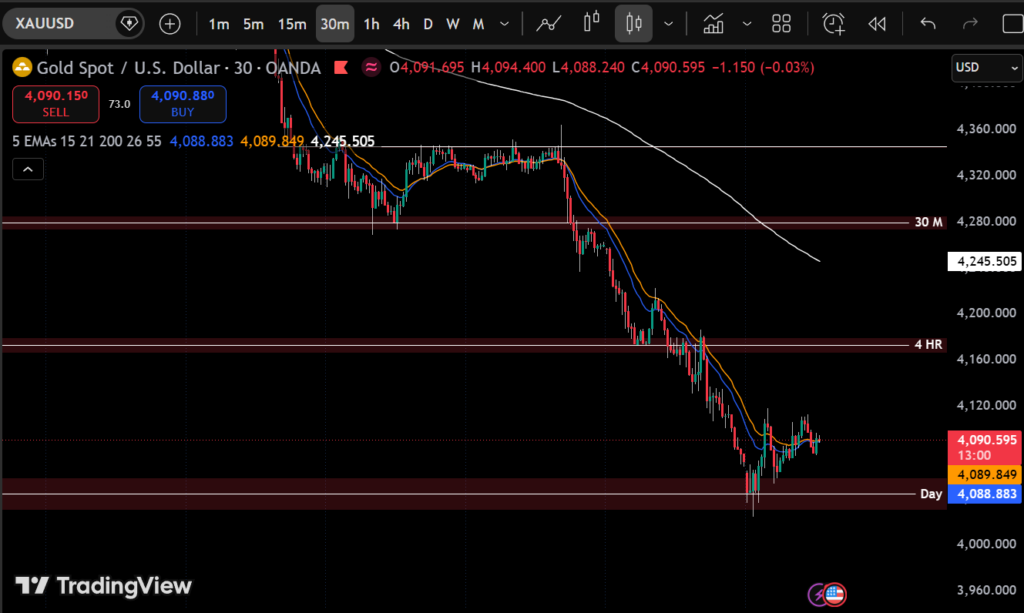
If you’ve looked at the gold ($XAUUSD$) charts lately, you might have felt a bit of whiplash. As seen on the 30-minute chart, gold recently took a dramatic dive, slicing clean through daily support zones to sit precariously below $4,100.
Here is a quick breakdown of why this safe-haven asset is bleeding, and how to navigate the volatility.
🚨 Why is the Market Falling?
- The Rate Hike Threat: Sticky U.S. inflation (4.2%) and strong jobs data mean the Federal Reserve may keep interest rates higher for longer—making non-yielding gold less attractive.
- Liquidity Selling: During broader market panic, institutional funds often aggressively dump liquid assets like gold just to raise quick cash and cover margins elsewhere.
- Technical Breakdown: On the chart, the price decisively broke major 4 HR and Day support levels. Sellers are firmly in control as price action trends heavily below the short-term EMAs.
🛠 Trader’s Playbook & Strategy
- Don’t Catch a Falling Knife: Avoid buying blindly just because it looks “cheap.” Wait for a clear reversal structure (like a double bottom) on the 4-hour or Daily chart first.
- Short-Term Play: Watch the short-term EMAs acting as a ceiling. Look to sell short relief rallies up into previous broken support zones (now turned resistance), or monitor the $4,000 psychological floor.
- Long-Term Play: The structural reasons to hold gold (debts, global risks) haven’t changed. Treat this flush-out as a discount window to build long positions in gradual stages.
- Manage Risk: Keep position sizes smaller than usual. Volatility is incredibly high, so give your stop-losses extra room to breathe.